Follow these simple steps to access your child's progress:
Go to the MobyMax website by entering www.mobymax.com/MC56839 in your browser's address bar.
On the homepage, choose the 'As a Parent' login option.
Click on "Sign in to the old parent dashboard using my child's login info instead" link at the bottom of the page, just under "Forgot your password?"
Input your child's Username and Password. The exact details your child logs in with.
Click 'Sign In' to access the portal.
If you encounter login issues, click 'Need Help?' or contact Ambition for support.


The 'Overview' tab provides a summary of the actual times your child spent on recent academic activities. The times listed below allow you to compare the actual time spent versus the time they should have spent according to the timetable.
The following sections explain each component of the Dashboard Overview in detail:
This table shows the actual time your child spent on each subject each day for the last 30 days. You can compare these actual times to the expected session times, which are based on the timetable and are listed below. Scroll down the list to see all of the subjects.

The pie chart illustrates the actual time your child has spent on each subject over the last 30 days. The table below shows the approximate target time for each subject as per the timetable. For instance, the target time for Maths is 720 minutes, calculated by scheduling 45 minutes daily from Monday to Thursday. This results in 180 minutes per week, which, multiplied by 4 weeks, totals 720 minutes.

Consistent practice is key to academic progress.
This chart tracks your child's grade level progress across the various subjects shown over the past 12 months. Each coloured line represents a different subject, with the vertical axis showing the grade level at which your child is performing.

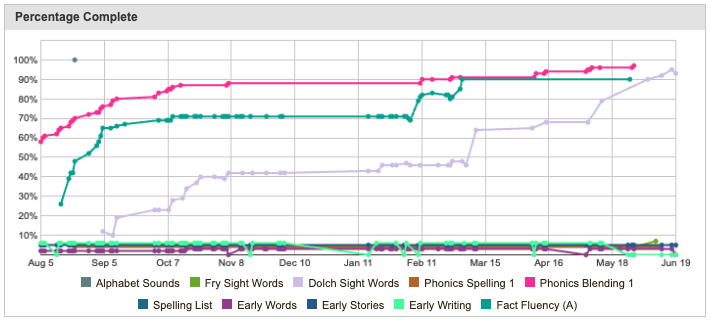
This chart shows the percentage of curriculum completed by your child in each subject over the past 12 months. MobyMax considers a skill "passed" when a student achieves the passing percentage, which is typically set at 80% by default.
For detailed information on specific subjects such as Math, Language, Science, and more, please select the corresponding icon or click 'More' to view the complete list of subjects. Below, you'll find a guide to understanding the Math report. This explanation is applicable to the other subjects as well.


The Overall Statistics section provides a comprehensive snapshot of your child's performance and engagement in each subject. These metrics help you understand not just what your child has learned, but how they're learning and at what pace.
7.4
This shows the grade level your child is currently working at. A score of 7.4 means they are in Grade 7 and about 40% of the way through the syllabus — roughly 4 months in, with 8 months to go. It’s a helpful way to track steady progress through the year.
3.0 grades per year
This chart shows the academic progress your child is on track to make in a year. Most MobyMax students grow by two or more grade levels annually. If progress is slower, a small boost in focus or time can make a big difference.
3,997 minutes
This shows the total time your child has spent learning in this subject since starting MobyMax. It includes interactive lessons, practice activities, placement tests, and benchmark assessments — all of which contribute to their progress and learning path.
131 sessions
This shows how many learning sessions your child has completed in this subject. Each session represents a time when they were actively working — doing lessons, quizzes, or practice activities — all helping them move forward in their learning.
54.52%
This shows how well your child stays focused during their Math sessions. A higher percentage means they were concentrating well while working. A lower percentage may suggest they were distracted or found the material challenging.
261 standards
This refers to the number of specific learning objectives or educational standards that your child has successfully mastered within the Math curriculum.
6 tests
This refers to the number of formal assessments or quizzes that a student has finished within the Math section of the platform.
61 lessons
This refers to the number of instructional units that a student has finished within the Math section. Each lesson typically includes interactive activities, explanations, examples, and practice exercises.
3,515 problems
This refers to the total number of individual practice exercises or problems that a student has finished. Problems cover a wide range of topics and difficulty levels.
This report shows how much of the Maths curriculum your child understands at each grade level — from Grade K up to their current level.
Shows what your child knew when they started MobyMax with the Placement Test
Shows what they've mastered now
Shows how much progress they've made

Your child had no learning gaps — they already understood 100% of the material.
Starting in Grade 2, gaps began to appear. For example:
This chart gives you a full picture of your child's learning journey:
It shows where gaps began in earlier grades.
It highlights how much progress they've made — including the gaps they've already closed.
It helps you see where support may still be needed — especially in newer grades.
This graph is an example of how MobyMax tracks a student’s academic growth over time. It shows the increase in grade level achieved each month. When the line rises, it means the student made noticeable progress during that period.
The graph helps parents and teachers see how consistently a student is improving and whether their learning is accelerating over time.

This section gives parents a clear summary of the Maths lessons their child has completed over the past 30 days. For each lesson, you'll see the lesson title and the percentage score your child achieved. A score of 80% or higher is considered a pass.
Parents can click on any lesson to view the actual content covered, offering insight into what their child is learning. This makes it easy to spot strengths and identify areas where extra support or revision might be helpful.

Lesson passed! Your child has demonstrated mastery of this concept and can move forward to new material.
The lesson will be automatically rescheduled. Your child will have another opportunity to master this material before moving on.
This graph shows a student’s academic growth over the course of several months. It reflects how much progress they’ve made in grade level each month. As the line rises, it means the student is gaining skills and moving ahead in the subject.
This helps parents and teachers see how learning is building over time — whether the student is making steady progress, accelerating, or could use a little extra support.

This graph shows how many Math standards your child has mastered each month while using MobyMax.
It gives a visual summary of their progress over time, helping you see how consistently they’ve been advancing.
BEach bar reflects the number of new standards passed in a month, so you can easily spot growth patterns, celebrate progress, and stay informed about your child’s learning journey.

Standards are specific learning objectives that define what students should know and be able to do at each grade level. Mastering these standards ensures your child is building a strong foundation for future learning.
